|
|
||
|---|---|---|
| .. | ||
| assets | ||
| README.md | ||
| lv_demo_music.c | ||
| lv_demo_music.h | ||
| lv_demo_music_list.c | ||
| lv_demo_music_list.h | ||
| lv_demo_music_main.c | ||
| lv_demo_music_main.h | ||
| screenshot1.gif | ||
README.md
Music player demo
Overview
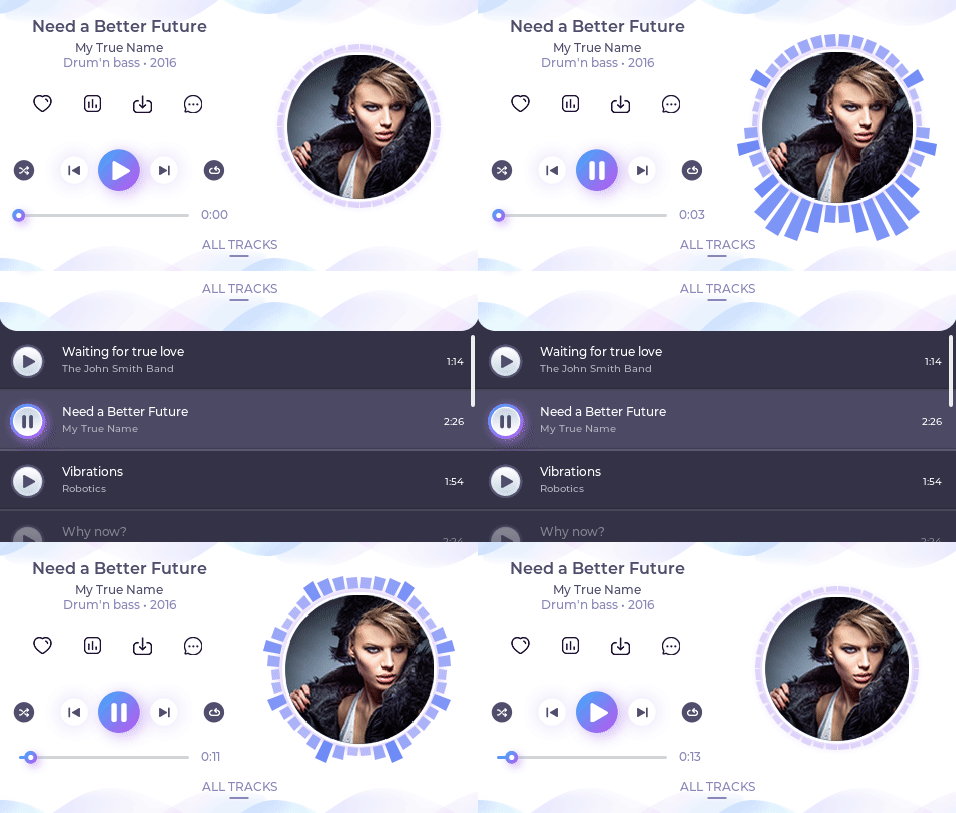
The music player demo shows what kind of modern, smartphone-like user interfaces can be created on LVGL. It works the best with display with 480x272 or 272x480 resolution.
Run the demo
- In
lv_conf.hor equivalent places setLV_USE_DEMO_MUSIC 1 - With
LV_DEMO_MUSIC_AUTO_PLAYenabled a ~60 sec demo will be played. - After
lv_init()and initializing the drivers calllv_demo_music()
How the spectrum animation works
assets/spectrum.pycreates an array of spectrum values from a music. 4 band are created with 33 samples/sec: bass, bass-mid, mid, mid-treble.- The spectrum meter UI does the followings:
- Zoom the album cover proportionality to the current bass value
- Display the 4 bands on the left side of a circle by default at 0°, 45°, 90°, 135°
- Add extra bars next to the "main bars" with a cosine shape. Add more bars for the lower bands.
- If there is a large enough bass, add a random offset to the position of the bars. E.g. start from 63° instead of 0°. (bars greater than 180° start again from 0°)
- If there is no bass, add 1 to the offset of the bars (it creates a "walking" effect)
- Mirror the bars to the right side of the circle
Using spectrum.py
- install
librosawithpip3 install librosa - run
python sectrum.py my_file.mp3 - see the result in
spectrum.h
