50 lines
2.4 KiB
Markdown
50 lines
2.4 KiB
Markdown
# Benchmark demo
|
||
|
||
## Overview
|
||
|
||
The benchmark demo tests the performance in various cases.
|
||
For example rectangle, border, shadow, text, image blending, image transformation, blending modes, etc.
|
||
All tests are repeated with 50% opacity.
|
||
|
||
The size and position of the objects during testing are set with a pseudo random number to make the benchmark repeatable.
|
||
|
||
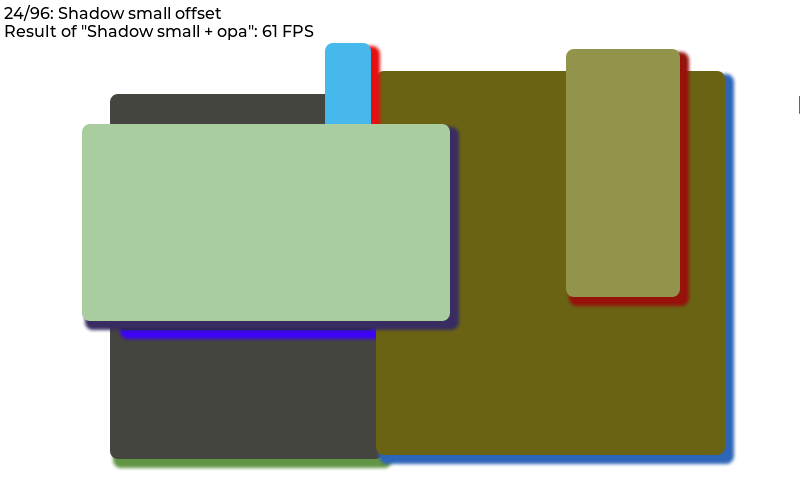
On to top of the screen the title of the current test step, and the result of the previous step is displayed.
|
||
|
||
## Run the benchmark
|
||
- In `lv_conf.h` or equivalent places set `LV_USE_DEMO_BENCHMARK 1`
|
||
- After `lv_init()` and initializing the drivers call `lv_demo_benchmark()`
|
||
|
||
## Interpret the result
|
||
|
||
The FPS is measured like this:
|
||
- load the next step
|
||
- in the display driver's `monitor_cb` accumulate the time-to-render and the number of cycles
|
||
- measure for 1 second
|
||
- calculate `FPS = time_sum / render_cnt`
|
||
|
||
Note that it can result in very high FPS results for simple cases.
|
||
E.g. if some simple rectangles are drawn in 5 ms, the benchmark will tell it's 200 FPS.
|
||
So it ignores `LV_DISP_REFR_PERIOD` which tells LVGL how often it should refresh the screen.
|
||
In other words, the benchmark shows the FPS from the pure rendering time.
|
||
|
||
By default, only the changed areas are refreshed. It means if only a few pixels are changed in 1 ms the benchmark will show 1000 FPS. To measure the performance with full screen refresh uncomment `lv_obj_invalidate(lv_scr_act())` in `monitor_cb()` in `lv_demo_benchmark.c`.
|
||
|
||

|
||
|
||
|
||
## Result summary
|
||
In the end, a table is created to display measured FPS values.
|
||
|
||
On top of the summary screen, the "Weighted FPS" value is shown.
|
||
In this, the result of the more common cases are taken into account with a higher weight.
|
||
|
||
"Opa. speed" shows the speed of the measurements with opacity compared to full opacity.
|
||
E.g. "Opa. speed = 90%" means that rendering with opacity is 10% slower.
|
||
|
||
In the first section of the table, "Slow but common cases", those cases are displayed which are considered common but were slower than 20 FPS.
|
||
|
||
Below this in the "All cases section" all the results are shown. The < 10 FPS results are shown with red, the >= 10 but < 20 FPS values are displayed with orange.
|
||
|
||
|
||

|